

7 Data Modeling Concepts You Must Know
Easy-to-understand explanations of foundational terminology
Everyone wants to learn more about data modeling. Or at least that’s what it seems like based on comments on newsletters and LinkedIn posts. After all, it is a foundational skill of any analytics engineer.
It’s also one of those topics where your knowledge can only grow deeper and deeper as you read up on it and encounter different scenarios in your work.
A few weeks ago I came across this video from Anna Abramova listing the 7 data modeling concepts every data person must know. I found it very insightful in discovering my own knowledge gaps and where I could learn more.
That being said, I wanted to share with you what I learned on these 7 data modeling concepts she highlights. As always, I describe these concepts in a way that’s easy for everyone to understand and include some helpful examples.
Facts and Dimensions
Dimensional data modeling is a method designed by Ralph Kimball that focuses on identifying key business practices and then building out the foundation of these practices before adding additional tables.
Ralph Kimball’s dimensional model techniques separate data into fact and dimension tables.
I like to think of fact tables as tables produced by different events that occur within a business. Actions in a business are typically represented as fact tables within the data warehouse.
Unlike fact tables which capture business events, dimension tables contain descriptive attributes. They are usually wide, flat tables that are also denormalized. They have a single primary key which exists as a foreign key in a fact table. Foreign keys in fact tables directly relate to the primary keys of dimension tables.
Dimension tables rarely change from day to day within a business while fact tables are always changing.
Star Schema
Star schemas are named this way because of their shape! A star schema describes a fact table surrounded by various dimension tables. They were introduced by Ralph Kimball in the 90s as part of dimensional data modeling.
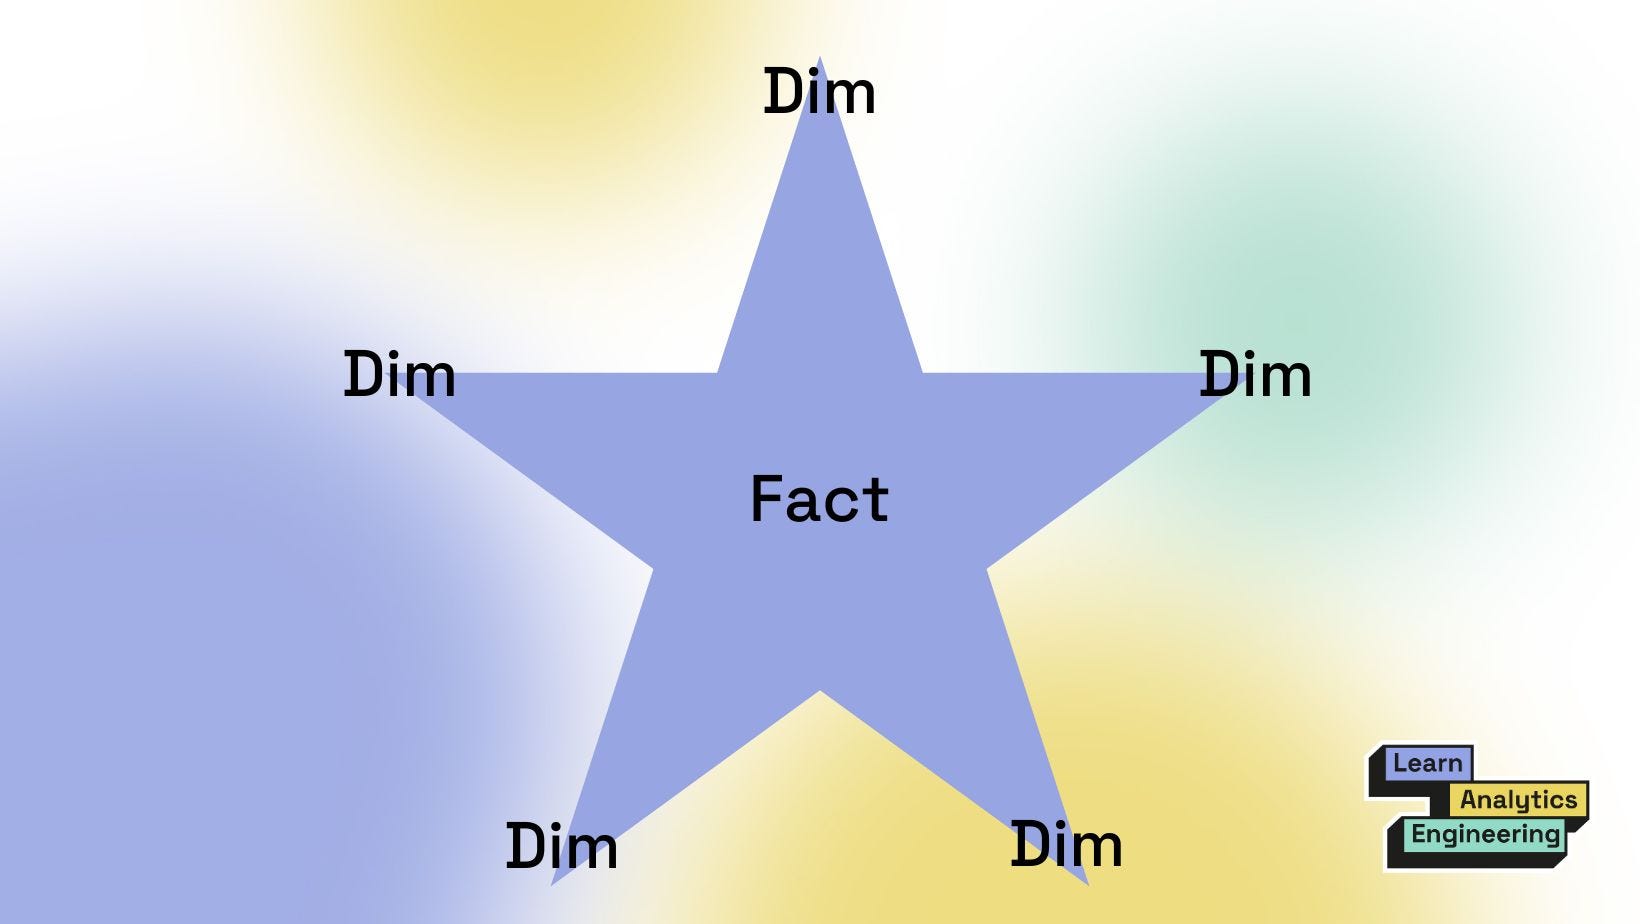
Star schemas are shaped this way due to a central fact table having multiple foreign keys, each mapping to the primary key of a dimension table. This way of storing data makes it fast to transform data in different tables for analytics use cases.
Slowly Changing Dimensions
A slowly changing dimension is a data record whose values change slowly over time.
A customer’s account data like email, address, and phone number is an example of a slowly changing dimension. The customer’s address won’t change every day, but it may change every two years.
The type of slowly changing dimension depends on how the changes are tracked in your database.
For example, Type 1 Slowly Changing Dimensions overwrite old values in your data. The new value will replace the old value, without any record of what the old value was. I find this is the method used in most databases.
Type 2 Slowly Changing Dimensions insert new values as new records in your database. They maintain the “old” records AND the new records. They have additional fields on the records that indicate a version number or the timestamps in which the value is effective.
Type 3 slowly changing dimensions maintain one record for the original primary key but utilize an “original” value field and a “current” value field. They track the previous and current values of a field in one record. However, this means they only track the most recent change in value and not the entire history of changes.
Type 4 slowly changing dimensions use two tables to represent one object. They use a table to store current values, and another table to store historical values. The history table contains one timestamp field that you can then use to piece together the chronological history of values.
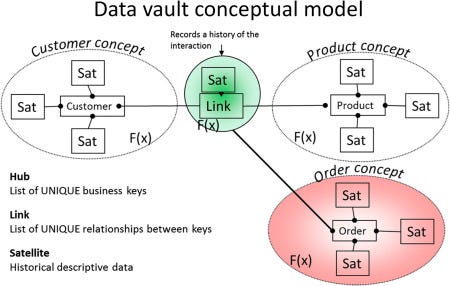
Data Vault Modeling
Data vaults differ from dimensional data modeling in that they are built to serve enterprise companies, helping them to scale their data. They consist of three main entities- hubs, links, and satellites.
You can think of hubs as the main business objects (like customers or products).
Links represent the relationships between hubs.
Satellites store all the information about the concepts and their relationships (similar to dimensions in dimensional data modeling).
This way of modeling is particularly beneficial for companies utilizing a data lakehouse rather than a data warehouse, as it can handle large volumes of less structured data.
