

Data Modeling Solves What Semantic Layers Can't
Why you need to fix the foundation before you can build more systems
I don’t have enough fingers and toes to count the number of times a stakeholder has asked me why the same metric in two different dashboards doesn’t match. We can agree that inconsistent metrics in the BI layer are a problem all analytics engineers and data analysts face.
AI enables stakeholders to dig deeper into data within the BI layer, but it doesn’t eliminate the risk of them incorrectly calculating metrics. The industry seems to think that the semantic layer is the solution to this problem, but most companies aren’t at a point where this makes sense.
While semantic layers may be a good next step for enterprise companies who have time and money to throw at it, it’s not for the smaller, scrappier data teams making the most of limited resources. Instead of focusing our attention on the semantic layer, we should be dedicating our efforts to proper data modeling. You can’t have consistent, easy-to-use metrics without robust, foundational data models.
More and more people are finally realizing that this is the key to safe, accurate, accelerated AI. Companies like Fabi.ai who are leading AI-enabled BI are emphasizing the importance of data modeling as the key to unlocking the most value from AI in your dashboards and reporting.
Hot take: semantic layers aren’t the solution, robust data modeling is.
I’ve worked with a lot of talented senior analytics engineers and data managers, but we were never in a place where we had a solid foundation of data models to support the business. There was always more modeling work to be done, leaving little room for other efforts. Working on a semantic layer just wouldn’t have made sense.
We needed to create robust, reusable, well-documented data models before we could think about metric calculations. The lack of proper modeling was ultimately the reason for inconsistency in the BI layer.
dbt lists the benefits of semantic layers as follows:
Eliminates inconsistencies
Improves data democratization
Promotes data reusability
Interestingly enough, these issues are best solved upstream in the data modeling layer rather than downstream, right before the BI layer. When you pair proper modeling with AI, you get all of these benefits without needing to implement and maintain yet another system.
How data modeling replaces the need for a semantic layer
Founders and lean data teams want something low-effort that scales with the team, not another system that takes time away from work that really matters. Taking the time to model your data the right way will pay dividends in future analysis projects independent of any tool or business initiative.
When you consciously build your models after how the business operates, following methods like dimensional data modeling, a semantic layer is not always necessary to achieve consistent, discoverable, and reusable metrics.
Eliminating inconsistencies
Inconsistencies come from poor planning and rushed modeling when solving business problems. Choosing the business process to model before modeling allows you to define the proper grain, dimensions, and facts needed to answer stakeholder questions in a scalable way. Otherwise, you’ll likely end up with a bunch of models addressing the same business processes but at slightly different grains.
A few years ago, the business I worked closely with always struggled to get accurate revenue metrics. Revenue metrics came from many different platforms, some of which were owned by the data team and others that were not. We lacked revenue models that allowed us to fully understand where these metrics were coming from, leading to conflicting business decisions.
Some data included currency conversions, others didn’t. Some included revenue from products as well as subscriptions, while others only included subscription fees. Before the analytics engineering team was built out, there were no broader-picture conversations across teams about what revenue even meant. Having these metric conversations allowed analytics engineers to do what they do best, model the data that can easily feed these metrics.
Once you have these metric conversations, analytics engineers can design and build models at the right grain that can be joined back to core business dimensions and power downstream data assets.
Improving data democratization
Stakeholders want to feel empowered, not confused when it comes to deciding which datasets they feel comfortable using and aggregating. Writing data models with additivity in mind allows stakeholders to do this.
Fully additive measures allow users to sum them up across any of the dimensions in a fact model. These are the best types of measures to put in the hands of business users, as they are unlimited in how they can be used.
Semi-additive measures can be summed up across some dimensions but not all (think point-in-time account balances for example). These are less intuitive to the business user. Non-additive measures are the least intuitive and usable as they can’t be summed across any dimensions (think ratios).
Kimball recommends always including the components of semi-additive or non-additive measures in fact models so that users have the ability to sum the components up if they wish. This also helps to communicate the relationship between metrics and measures with business users.
When building and documenting your models, make it clear what can be rolled up and what can’t. This can be through column suffixes or in the documentation itself. And, when possible, always choose to use additive measures over semi-additive or non-additive, as this will eliminate a lot of confusion.
Sure, you can spend time documenting this in your semantic layer but really these issues should first be addressed in your data models.
Promoting data reusability
dbt states, “A semantic model enables a single team to maintain one gold standard data set that other teams can leverage and build upon”.... But how can you have a single gold standard data set without first evaluating the data modeling techniques you are using?
Before thinking about a semantic layer, you need to first address underlying data modeling issues like grain, unnecessary aggregations, and business processes.
By building on top of a system that is inherently broken, you create more work to manage and more tech debt to fix in the future. First, you need to address a lack of data modeling best practices and principles so that you can scale your data. When you do this, then you can think about building a semantic layer.
How this looks in practice
Let’s pretend we have a data model representing revenue per product. However, the data is aggregated by day, product, and customer. Measures at this grain include average transaction amount, average discount, and total transactions. Averages are not additive but total transactions are. Overall, we have a model that was poorly planned and not intuitive for AI to use.
Not to mention, if the business asks for an additional revenue metric, we would have to rebuild the data model entirely or create a new model at a different grain, leading to drifting metrics.
If we fixed this data model to be at the grain of order, timestamp, product, and customer, while also removing any aggregated average measures, we would be able to slice and dice as needed. Our model would be at the most granular level and all measures would be additive, making it easy for a BI tool like Fabi.ai to interpret the data, thus enabling self-service analytics and easing ad hoc data question handling.
Now, if we ask Fabi.ai to tell us how much revenue we made on December 1st, it can interpret the data model to give you the correct metric:
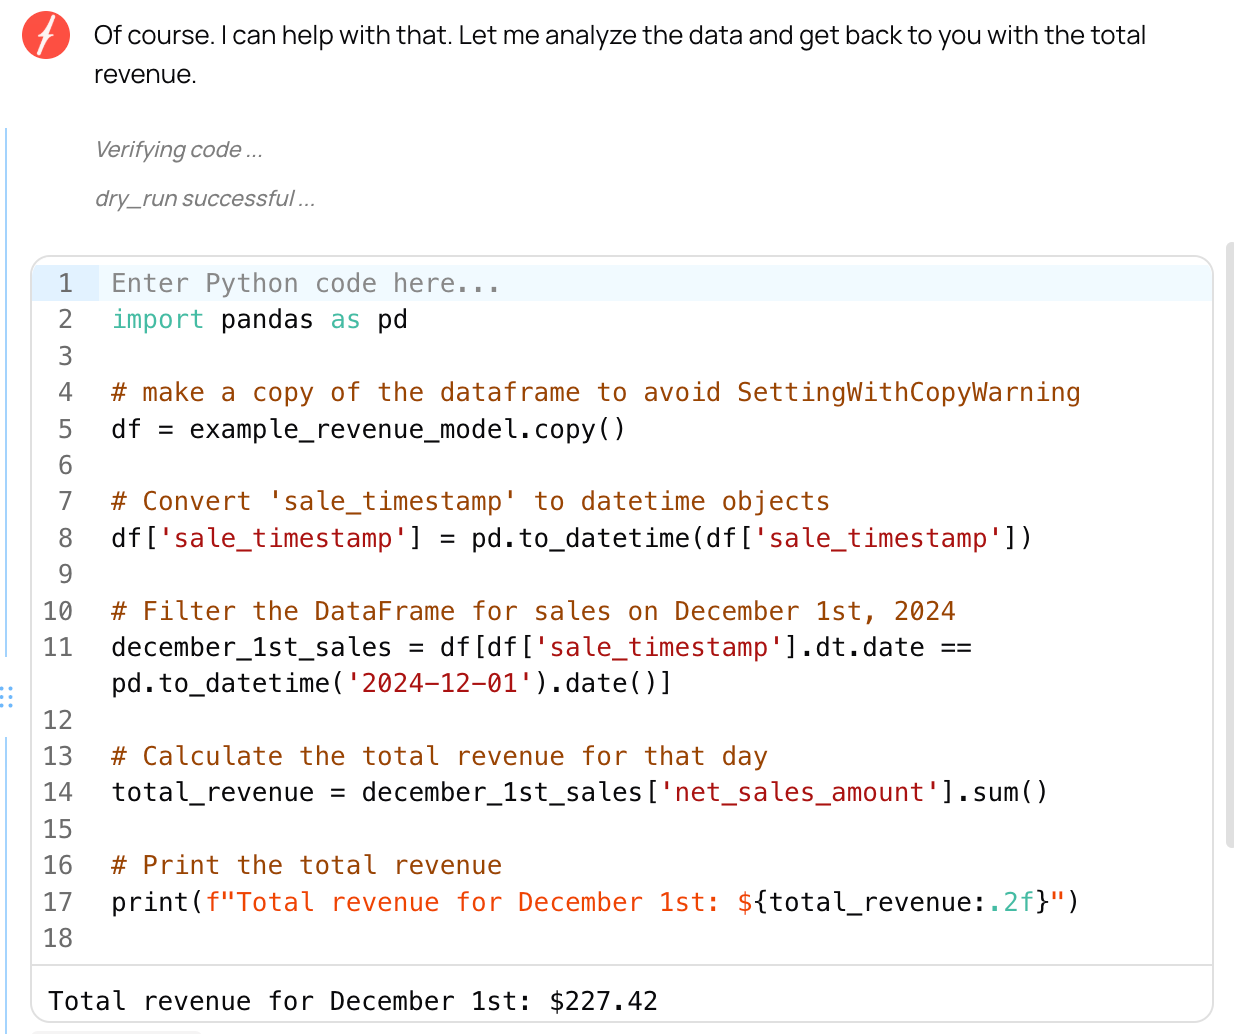
It provides the code that it uses to generate the metric, giving you the ability to fact-check its definition. This means it doesn’t exist in a black box like many AI tools, but gives you the ability to easily read and adjust its work as needed.
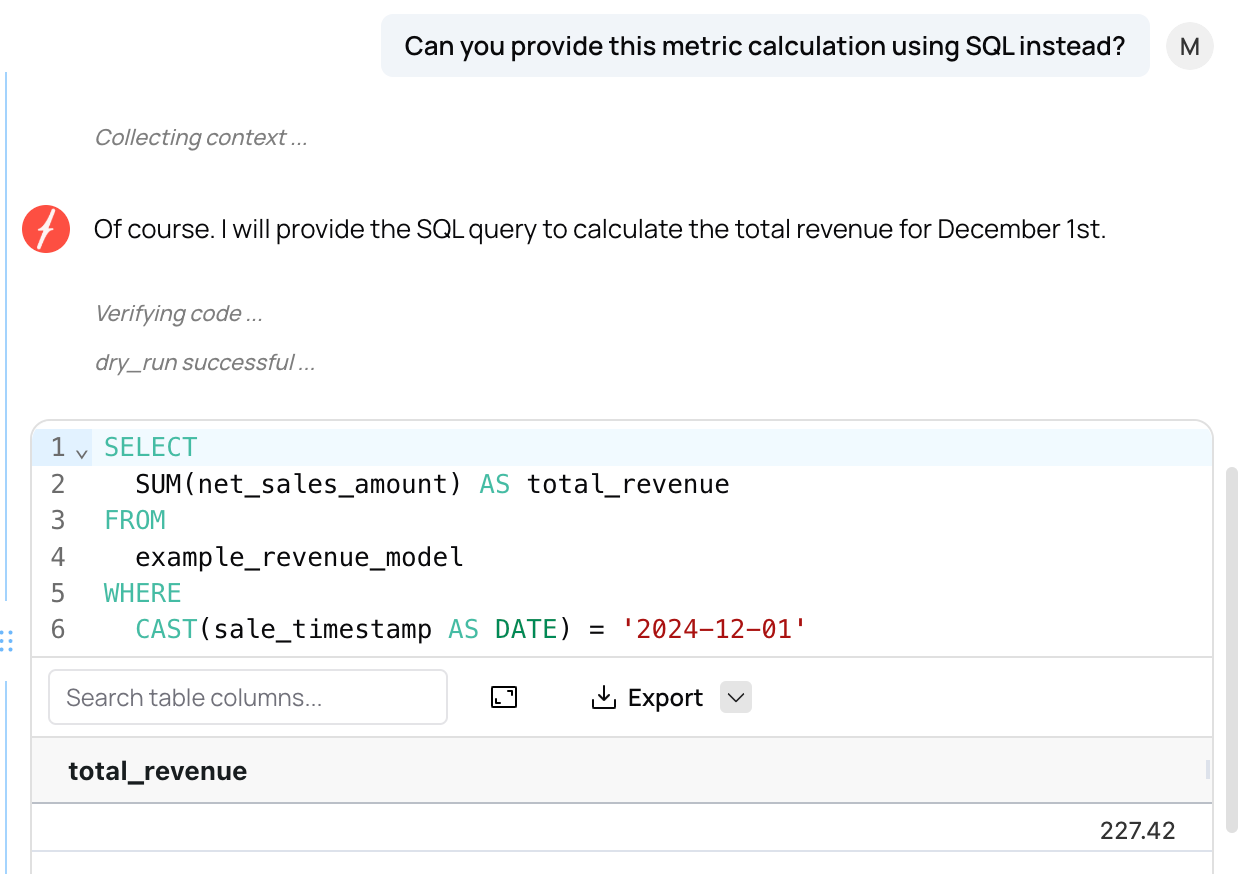
Fabi.ai works in both Python and SQL, providing you with flexibility in the language that you work in. If you want to instead generate the metric calculation in SQL, it will rewrite the calculation and provide the code for you.
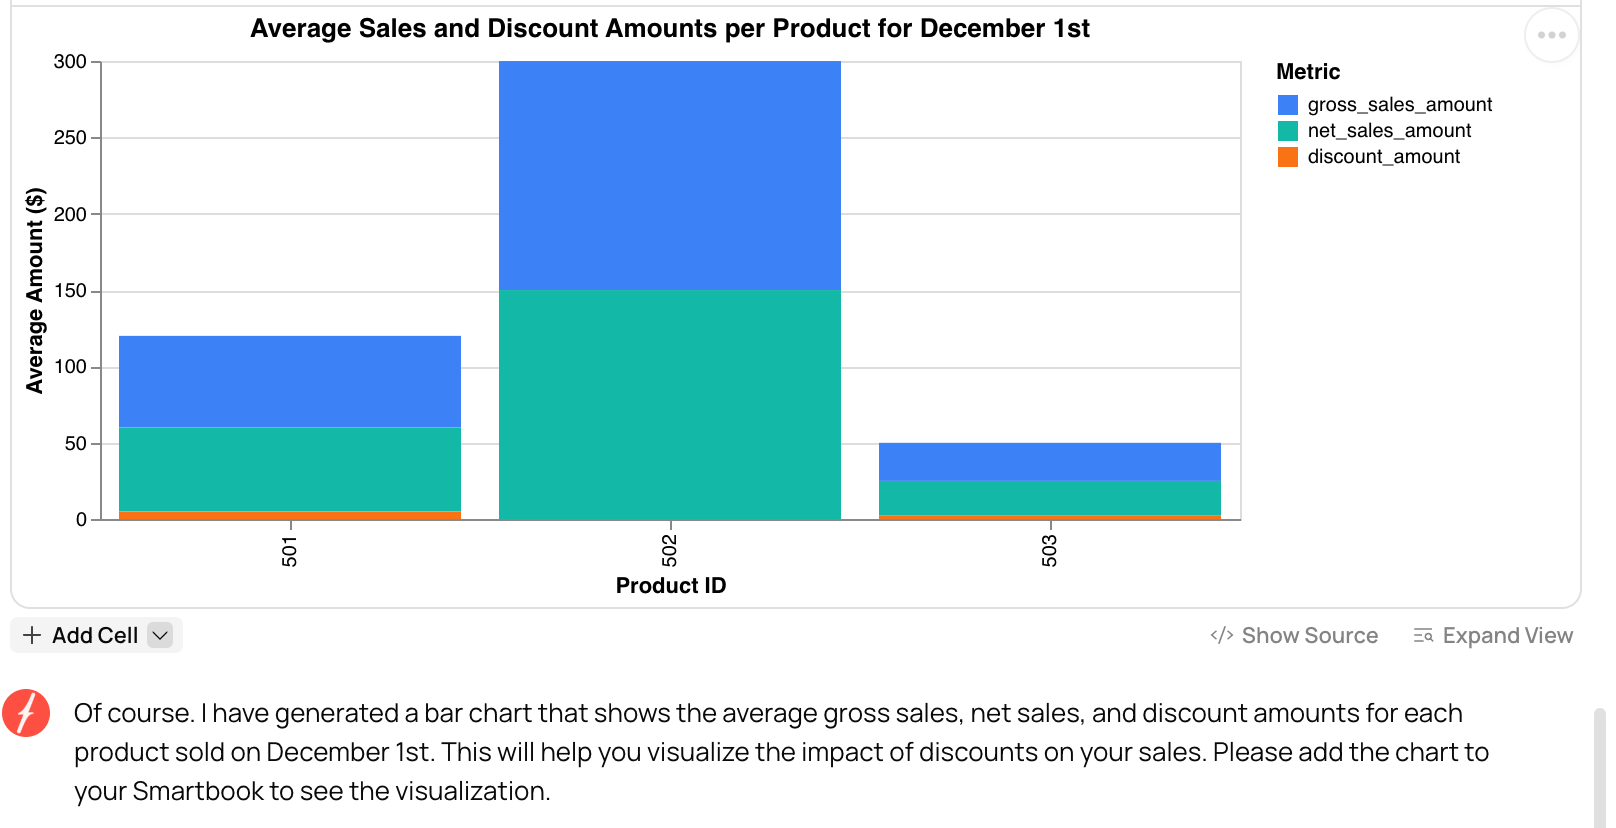
Fabi.ai not only generates the code behind metric calculations, but also generates visuals of your data. Instead of waiting for the data team, tech-savvy stakeholders can take advantage of the well-thought-out data models built by analytics engineers. No semantic layer required.
This is only something you can feel confident doing when you have consistent, intuitive data models under the hood that empower AI to do what it does best. With Fabi.ai, you don’t have to worry about creating additional work on top of your data models. Focus on modeling out your business processes and the tool will make finding insights easy.
The rush to implement semantic layers often stems from the same impulse that created the problem in the first place: trying to fix downstream issues with downstream solutions. Metric inconsistencies, however, come from a lack of proper data modeling.
When you spend time thinking through business processes, defining proper grain, and building additive measures, you create a foundation that scales naturally with AI tools. Lean data teams can move fast, spending their time on data modeling, and letting AI handle the insights, rather than focusing on a system that doesn’t yet make sense for them.
Have a great week!
Madison
Dealing with something like this these days. Thanks for sharing.
Thanks for sharing your thoughts on this topic Madison. I agree (and coming from experience) that a good strong and well-thought data model is the first step to ensure accuracy for reporting. With the right level of granularity and with additive facts, metrics can be built from documentation and definitions.
One thing which I think a semantic model has a place for is to ensure consistency in access to metrics across departments in an organization. I think a clean data model allows metrics to be build from a single source of truth (i.e. a fact table) by a data analyst within a department, but if different departmental analysts build the same metric but apply different conditions due to departmental needs, then there would be a "logic drift" across the departments: the data model is good, data is granular, there is a single source of truth, but different departments in the organization produce different 'flavors' of the same metric. For example, a sales department may consider 'total revenue' as the sum of all revenue, while a finance department may only want to sum revenue with a non-null post-date.
In such a case, wouldn't it be beneficial to capture these nuances in a semantic model by the core data team, and potentially in a central semantic model, so that these nuances are made available for all users in the organization? Curious to read your thoughts on this!